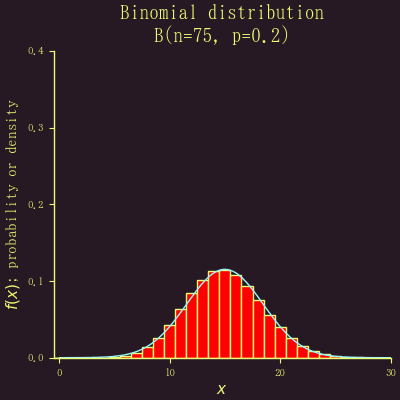
二項分布 B(n, p) において,n がそんなに大きくない場合は,p が 0.5 でないときには分布はかなり歪んでいる。しかし,n が大きくなると,だんだん正規分布に近づいていく。
その様子を示したのが以下の GIF アニメーション。最後の状態 n = 75 のときの場合を別途掲示する。
using Plots, PlotThemes, Rmath
function binomialdistribution(p; fps=7)
maxx = 30
theme(:lime)
pyplot(grid=false, xlims=(-0.5, maxx), ylims=(0, 0.4),
label="", size=(400, 400))
x2 = 0:0.1:maxx
anim = @animate for ni = 1:floor(Int, maxx/2p)
x = 0:ni
y = dbinom.(x, ni, p)
bar(x, y, bar_width=1, color=:red, tick_direction=:out,
xlabel="\$x\$", ylabel="\$f(x)\$; probability or density")
y2 = dnorm.(x2, ni*p, sqrt(ni*p*(1-p)))
plot!(x2, y2, color=:cadetblue1,
title="Binomial distribution\nB(n=$ni, p=$p)")
end
savefig("last.png")
gif(anim, "binomialdistribution.gif", fps=fps)
end
d = binomialdistribution(0.2)